How to calculate sample size
It's always hard to measure if your tests have adequate data to show conclusive results. You can fix this massive problem with two simple solutions: a sample size calculator and a stats engine. In this article, see how to calculate sample size, prove results and improve your confidence level.

Building a culture of experimentation has the potential to simplify your customer experiences and increase conversions...
However, it can also hurt you if you can’t reach statistically significant results.
To start, you need an adequate sample size to run a test without any margin of error. Next, you run these tests for a period long enough to get statistically significant results.
As you’re running experiments and a/b tests, it’s better to stop a test only when your variations reach significance instead of a random sample size. If some of the variations have not reached significance, decide if you want to wait for the number of visitors to increase or a larger sample size.
In this article, see how to estimate experiment length in advance, measure results through market research, and calculate how much traffic you’ll need for your conversion rate experiments.
Importance of sample size calculation
An appropriate sample size ensures:
- Statistical validity: Adequate sample sizes help avoid false positives and false negatives, leading to more reliable conclusions for a relevant population size.
- Resource optimization: Proper sizing prevents wasting resources on inconclusive tests or running tests longer than necessary.
- Business impact: Accurate results from well-sized tests lead to better business decisions and improved ROI on testing efforts.
Larger sample sizes may provide more accurate results but need more time and resources. Consider the following when determining your approach:
- Test duration: Longer tests may conflict with business cycles or seasonal changes.
- Opportunity cost: Running one large test might prevent you from running multiple smaller tests.
- Iterative learning: Sometimes, running quicker tests with smaller samples can provide valuable insights for refining your testing strategy.
Required sample size and time frame for A/B testing
To have a clear winner between different variations you have in a test group, you need to test enough with a minimum sample size or the number of people. Once you have the results, check if there is a statistically significant difference instead of a null hypothesis.
For example, if you want to test headline copy on a landing page, it can take a few weeks to show results. Think of a similar timeframe for your blog engine.
It all depends on your company, sample size, what tool you use to conduct A/B tests, and more. If you have a small list, you'll need to A/B test most of it to reach a significance level.
However, sample size determination isn't always a "set it and forget it" metric. Consider recalculating when:
- Your baseline conversion rate changes significantly.
- You want to detect smaller or larger effects than initially planned.
- Resource constraints or business priorities shift, affecting your ability to run tests.
How to calculate sample size
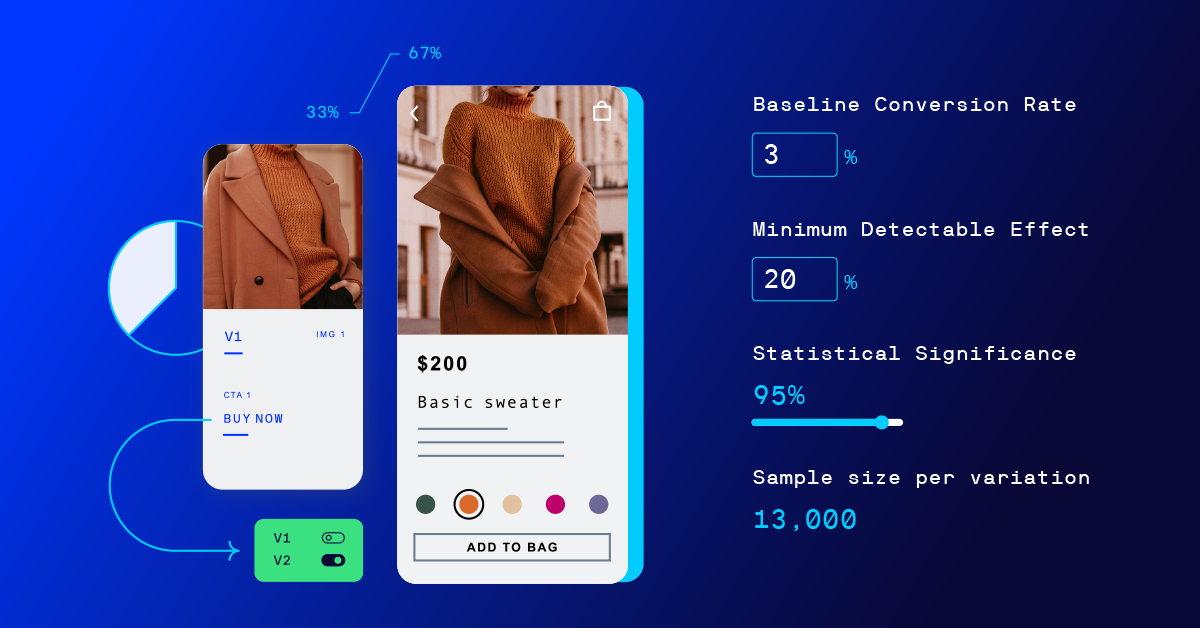
If you’re wondering how to calculate sample size, the best way is to use metrics such as baseline conversion rate (it is your control group's expected conversion rate) and minimum detectable effect (mde) to help with sample sizes for your original and variation, so you meet statistical goals.
The values you input for the ab test sample size calculator will be unique to each experiment and goal. With time, more visitors will arrive, encounter your variations and convert. Now you will start to see statistical significance increase and receive an accurate estimate of test duration.
Here are two sample size formulas to help you translate sample size into the estimated number of days you'll require to run an experiment:
- Calculation 1: Total number of visitors you need = Sample size × Number of variations in your experiment
- Calculation 2: Estimated number of days to run experiment = Total number of visitors you need ÷ Average number of visitors per day
Also, be aware of these common mistakes when determining sample sizes for groups of people:
- Ignoring variable conversion rates: Different pages or user segments may have different baseline conversion rates, affecting required sample sizes.
- Overlooking practical significance: Statistical significance doesn't always equate to business value. Consider the practical impact of detected differences.
- Neglecting external factors in your research project: Seasonal trends, representative sample, number of individuals, number of respondents, marketing campaigns, or other external events can influence test results and required sample sizes.
Advanced sample size estimation techniques
Here are six statistical test techniques to get you started for your target population:
- Power analysis: Ensures your test can detect true effects when they exist. It considers the significance level (usually 0.05), power level (often 0.8), and expected effect size. Proper power analysis helps avoid inconclusive tests.
- Variance estimation: Crucial for accurate sample size calculation, especially in conversion rate tests. It involves estimating the variability in your data based on expected conversion rates.
- Sequential analysis: Sequential testing allows for the early stopping of tests when strong evidence is found. Methods like the Sequential Probability Ratio Test (SPRT) can potentially reduce required sample sizes and save resources.
- Adjusting for multiple comparisons: When testing multiple variations or metrics simultaneously, it's important to adjust significance levels. This prevents an increase in false positives that can occur with multiple tests.
- Bayesian approach: Bayesian testing incorporates prior knowledge into sample size calculations. This method can provide more intuitive interpretations of results and is particularly useful when reliable prior information is available.
- Variance inflation adjustment: Accounts for correlations in cluster randomized trials or tests with repeated measures. This ensures adequate sample sizes when data points are not entirely independent.
Remember, no matter what approach you pick, the outcome you want isn’t far away.
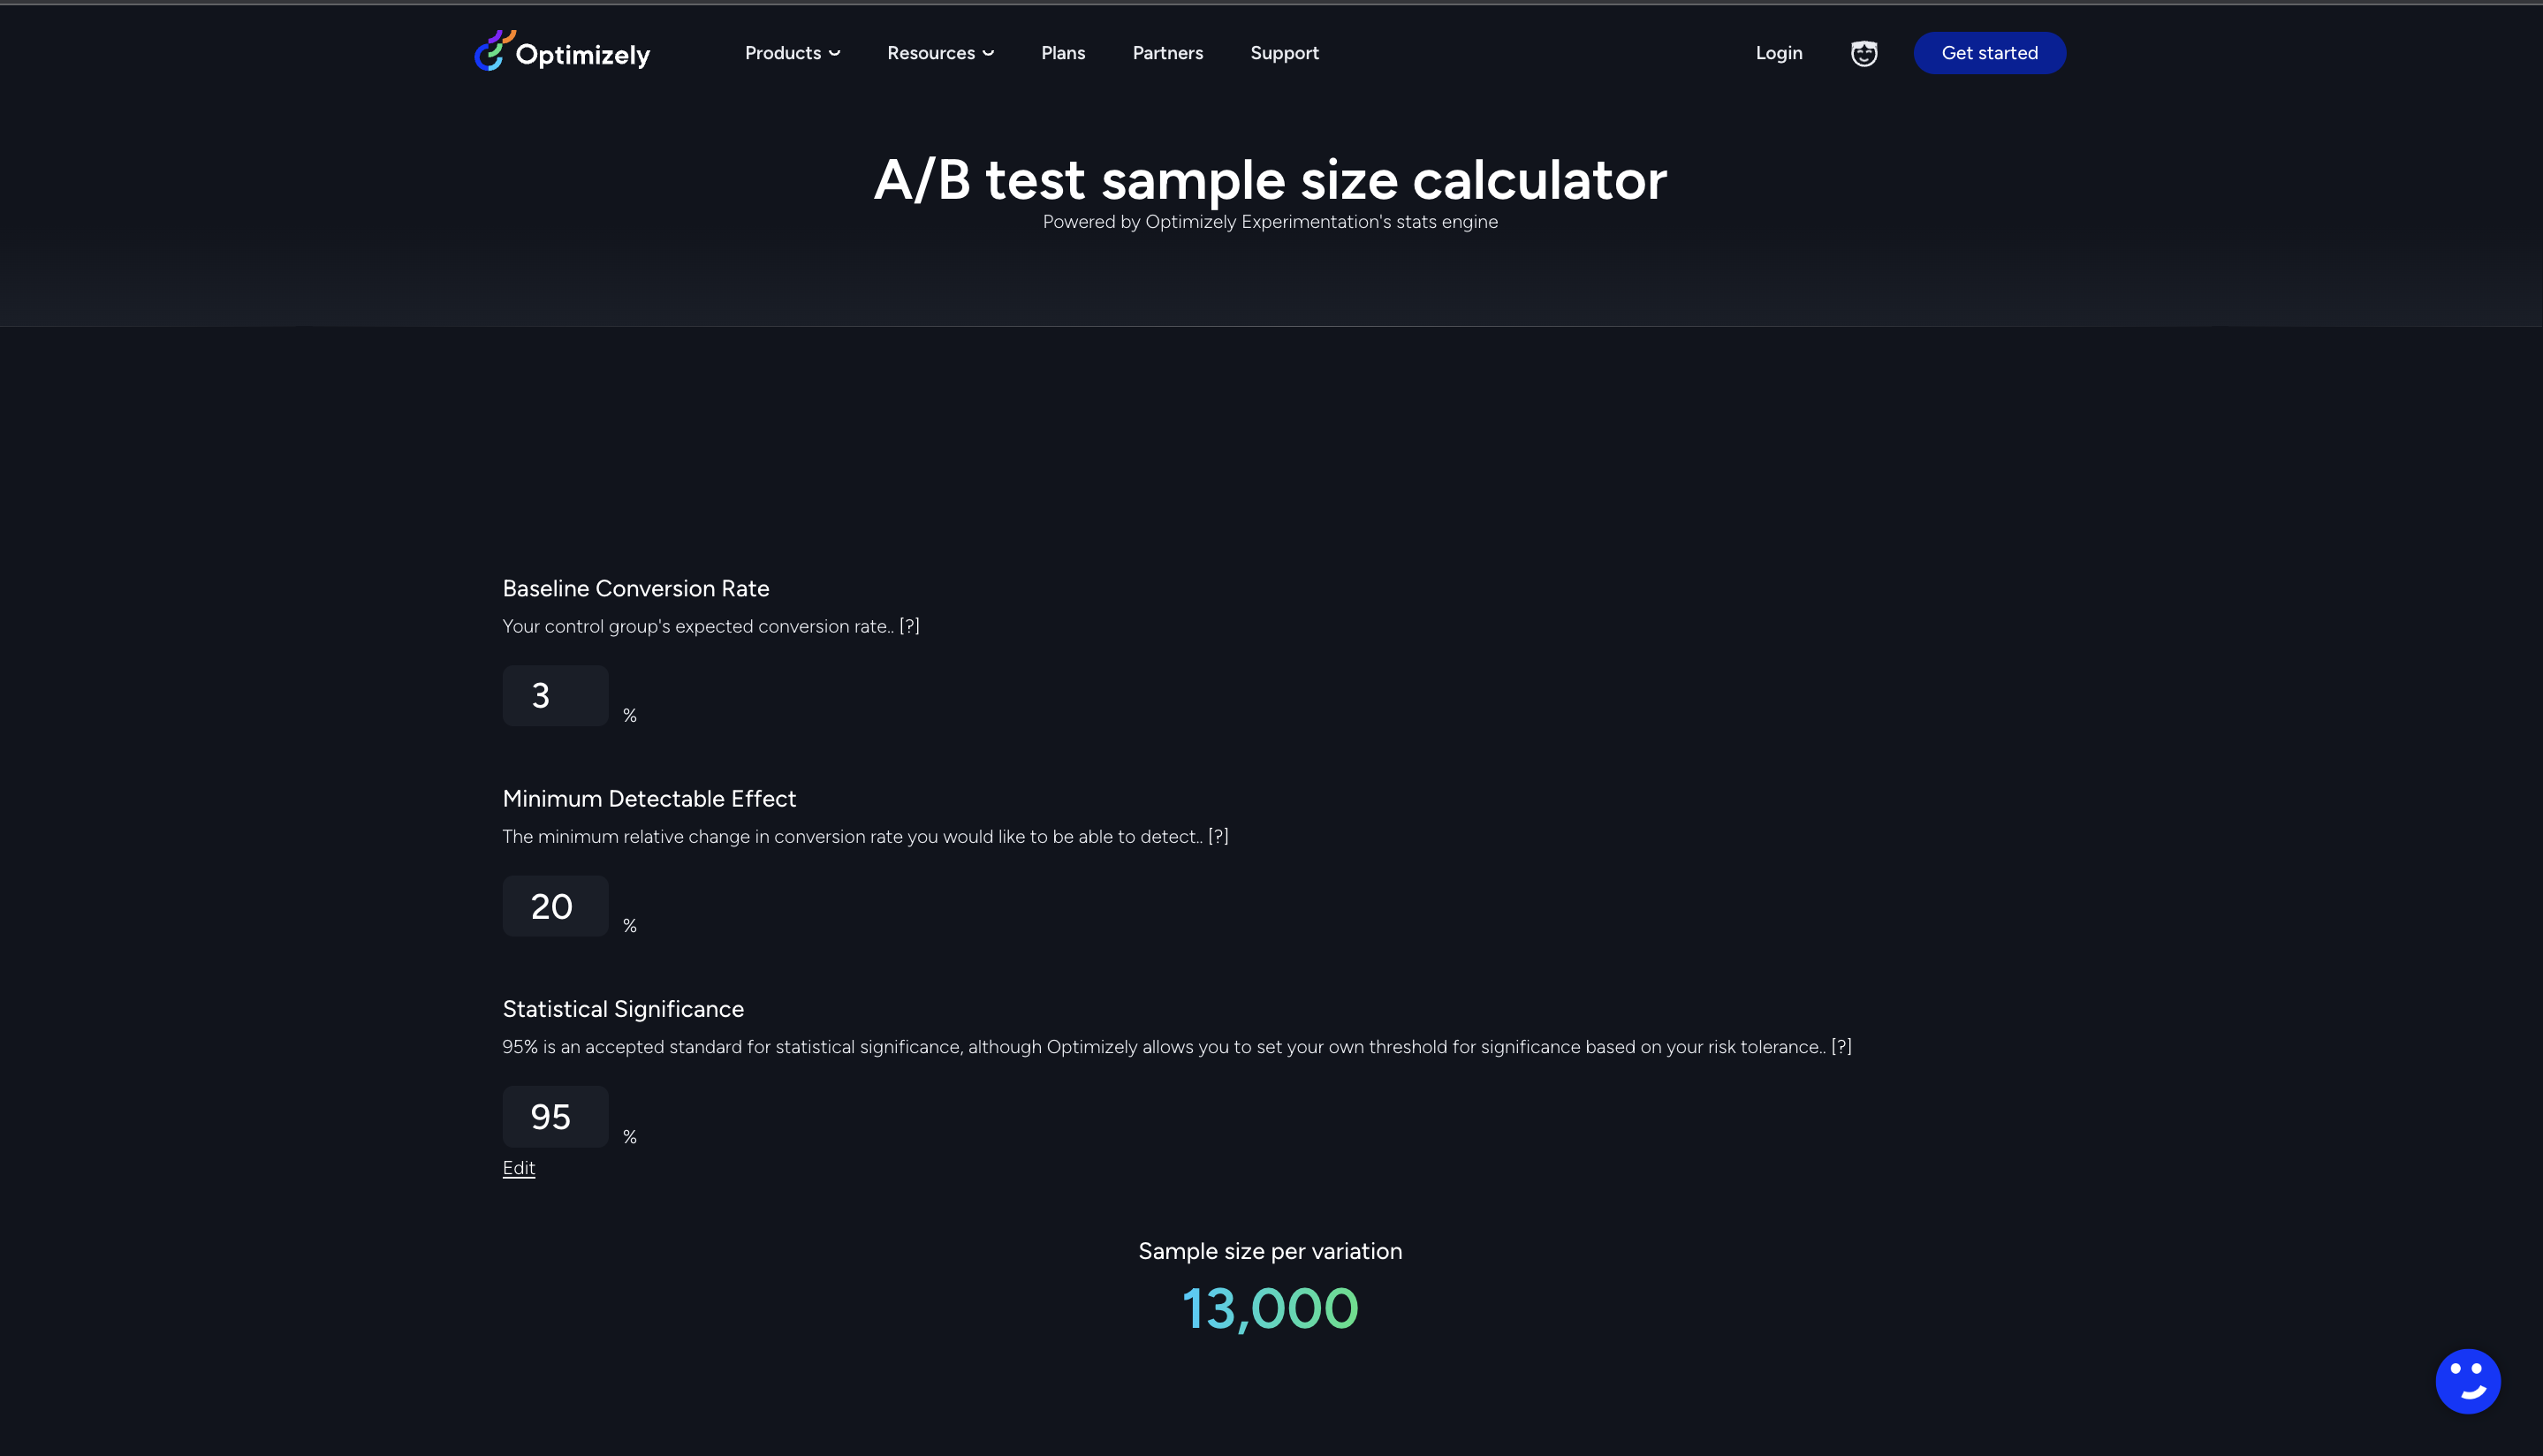
The outcome you want isn’t far away. Optimizely's sample size calculator offers accurate results in seconds. Use it and it’ll show your sample size.Here's what it looks like:
The best part?
There is no necessity for solely relying on sample size calculation to show the validity of your results. Use it for the planning phase. For the rest, we have the Stats Engine.
What is Stats Engine?
If you’re wondering what makes a good test, then speculation is not the answer. Go on a hunch through false positives and your error rate can skyrocket over 30%.
Speed and scale impact your digital experiences if they are data-driven and based on the accuracy of results. This is where a stats engine can help you. You can remove guessing problems by taking a sequential testing approach.
It measures the standard deviation in your process and helps you drive impactful change to your business, guided by data, so you can make faster decisions for building a culture of experimentation. Here're other benefits:
You can monitor results in real-time to make data-driven decisions quickly without sacrificing the integrity of data.
The statistical power of a sequential test naturally increases as the test continues to run, eliminating the need for hypothesis testing and arbitrary guesses about your effect sizes.
You can adapt to the true effect size automatically and stop early for larger-than-expected effect sizes, enabling faster times to significance on average.
You can clearly see the statistical likelihood that the improvement is due to changes you made, not a chance. So, choosing the right significance level matters as it increases confidence in your a/b testing methods. The confidence interval on improvement has to move away from zero to allow an experiment to reach a state of significance.
You can check out the full whitepaper here to see how experimentation runs on a stats engine.
Fixing your sample size problem...
It is not easy to keep an eye on your experiments and whether they have adequate statistical analysis to reach a conclusive result. This massive problem can be fixed with Optimizely.
Our stats engine achieves a power of one, so your test results will always have data to show. Use it to quickly change your digital marketing plans and focus on Conversion Rate Optimization (CRO).
If you want a better understanding of your AB tests and deliver modern e-commerce experiences, check out this 2024 big book of experimentation. It has 40+ real stories of organizations that benefitted from building a culture of experimentation.
![]()